Commercial UAV Simulation

UAV Operations Planning

A planning engagement for commercial UAV operators. Simulation is one stage of the workflow, used to characterize the antenna in isolation and once integrated on the airframe, model dynamic uplink and downlink propagation along the mission route, and predict link reliability before the aircraft is on a deployment manifest.

Simulation for operational optimization

Simulation serves three functions in UAV operations: deployment planning, link planning, and predictive performance under varying conditions. Integrated into a single workflow, they produce a compounding set of operational returns: shorter flights, higher throughput per crew-day, and the link reliability needed to bid and win work that requires documented RF performance.

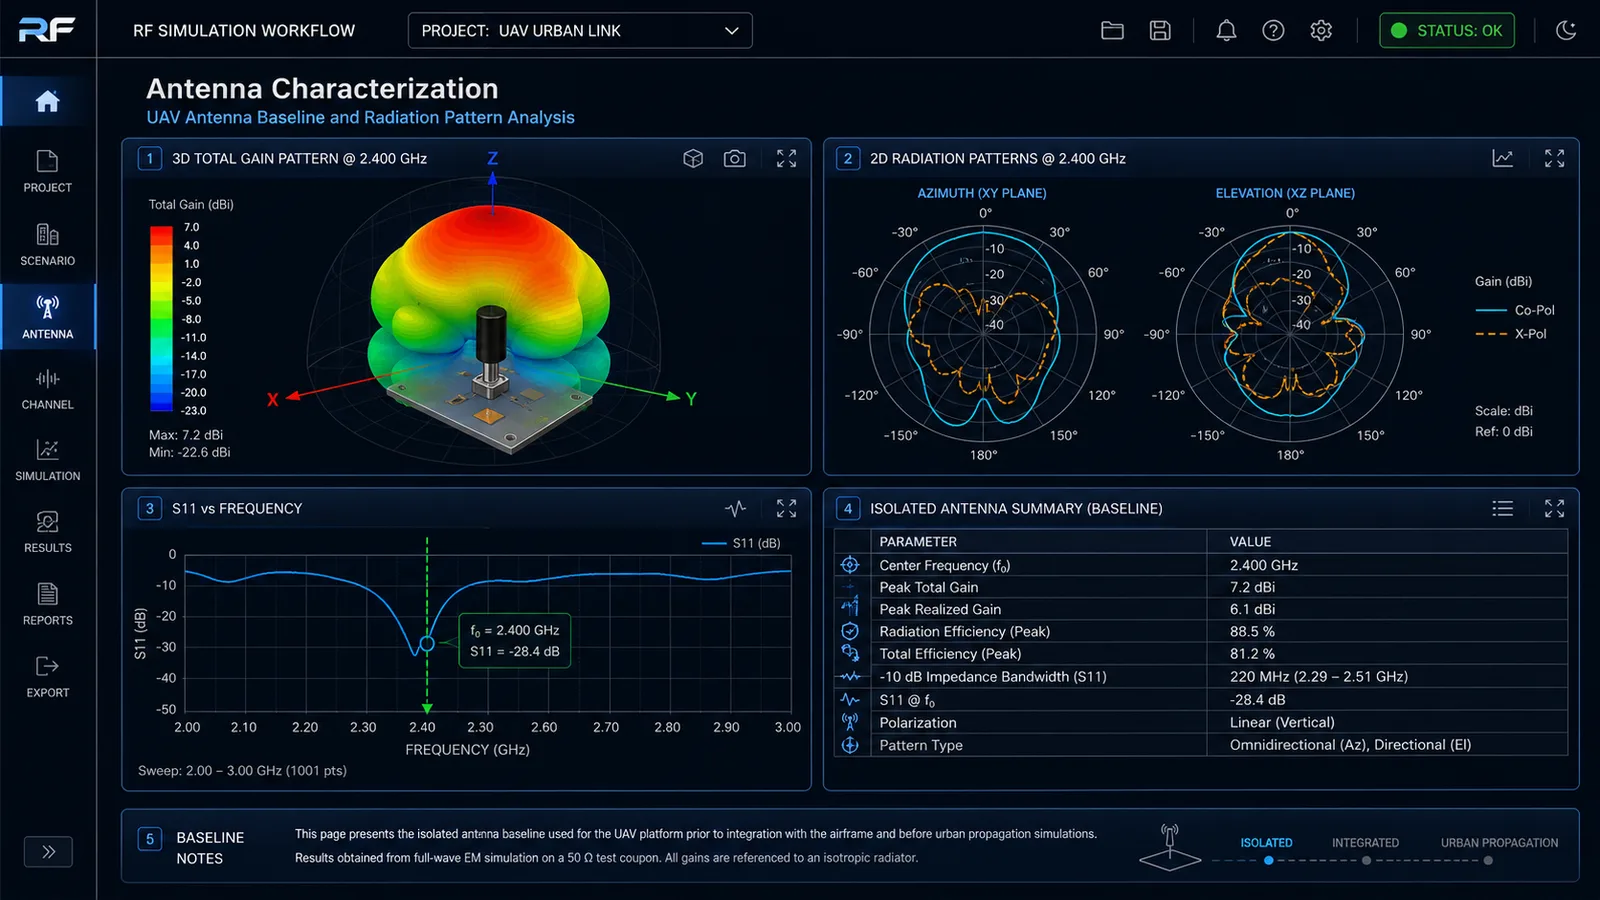
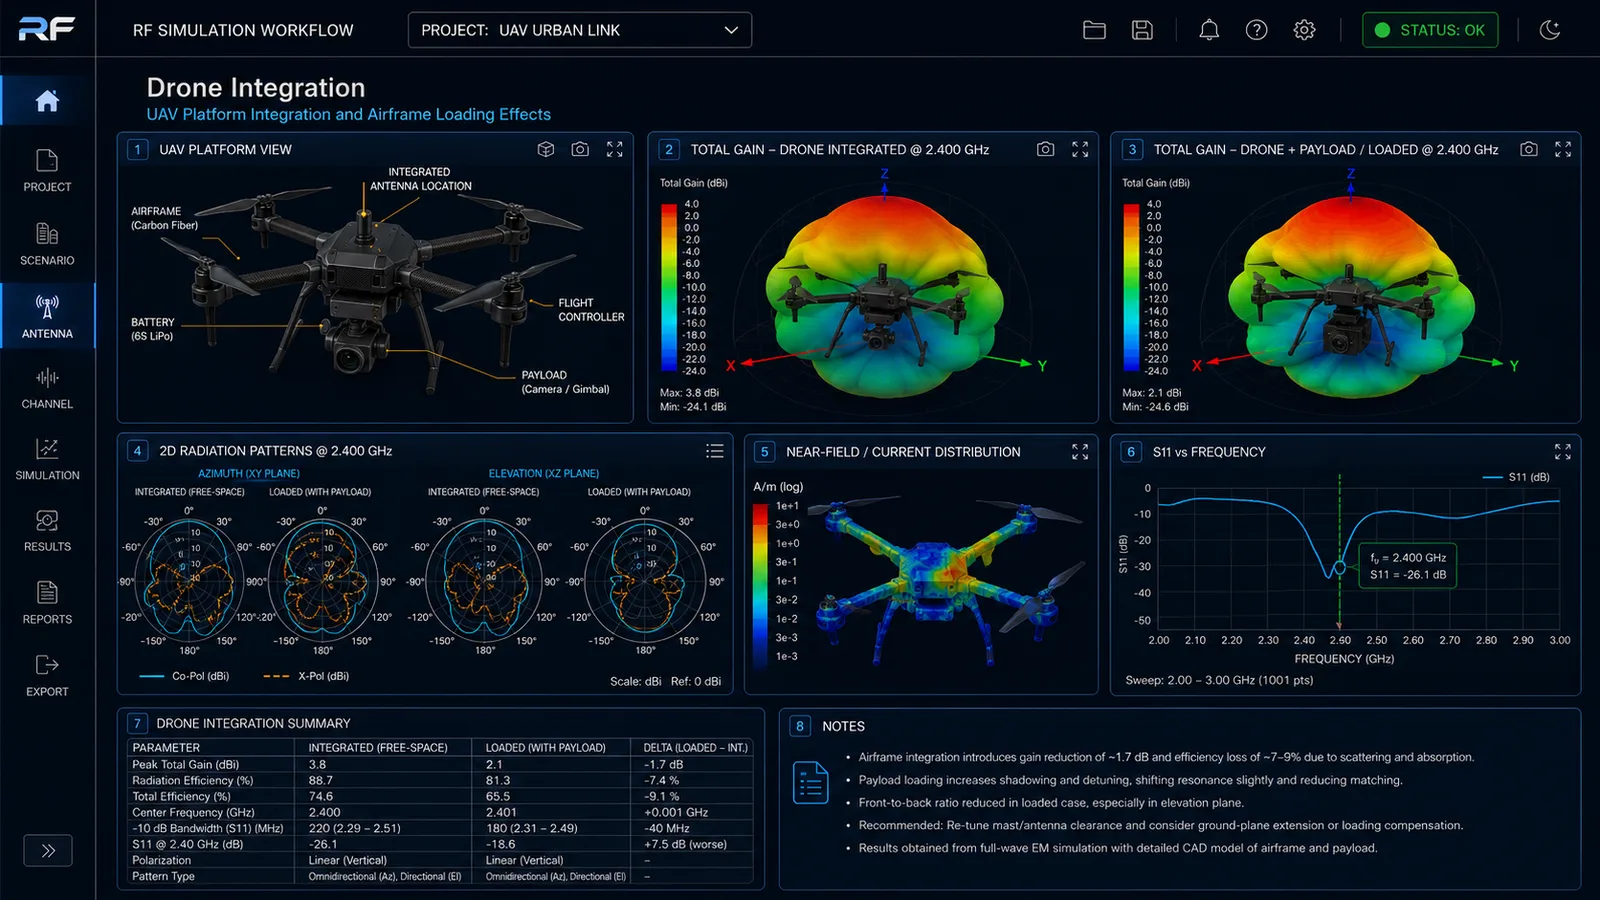
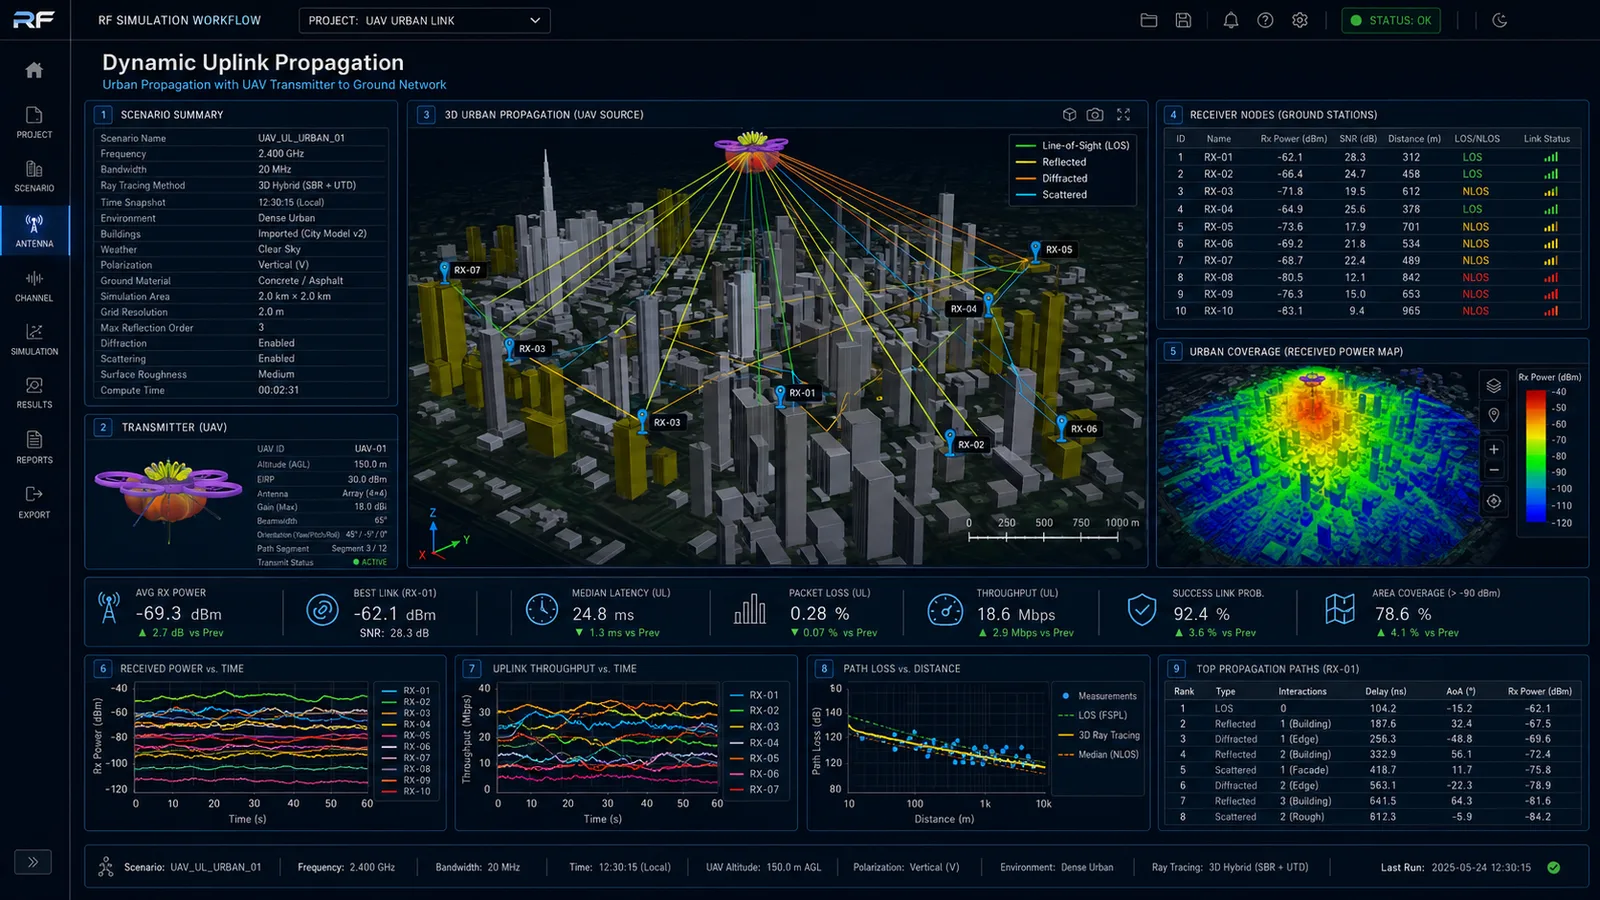
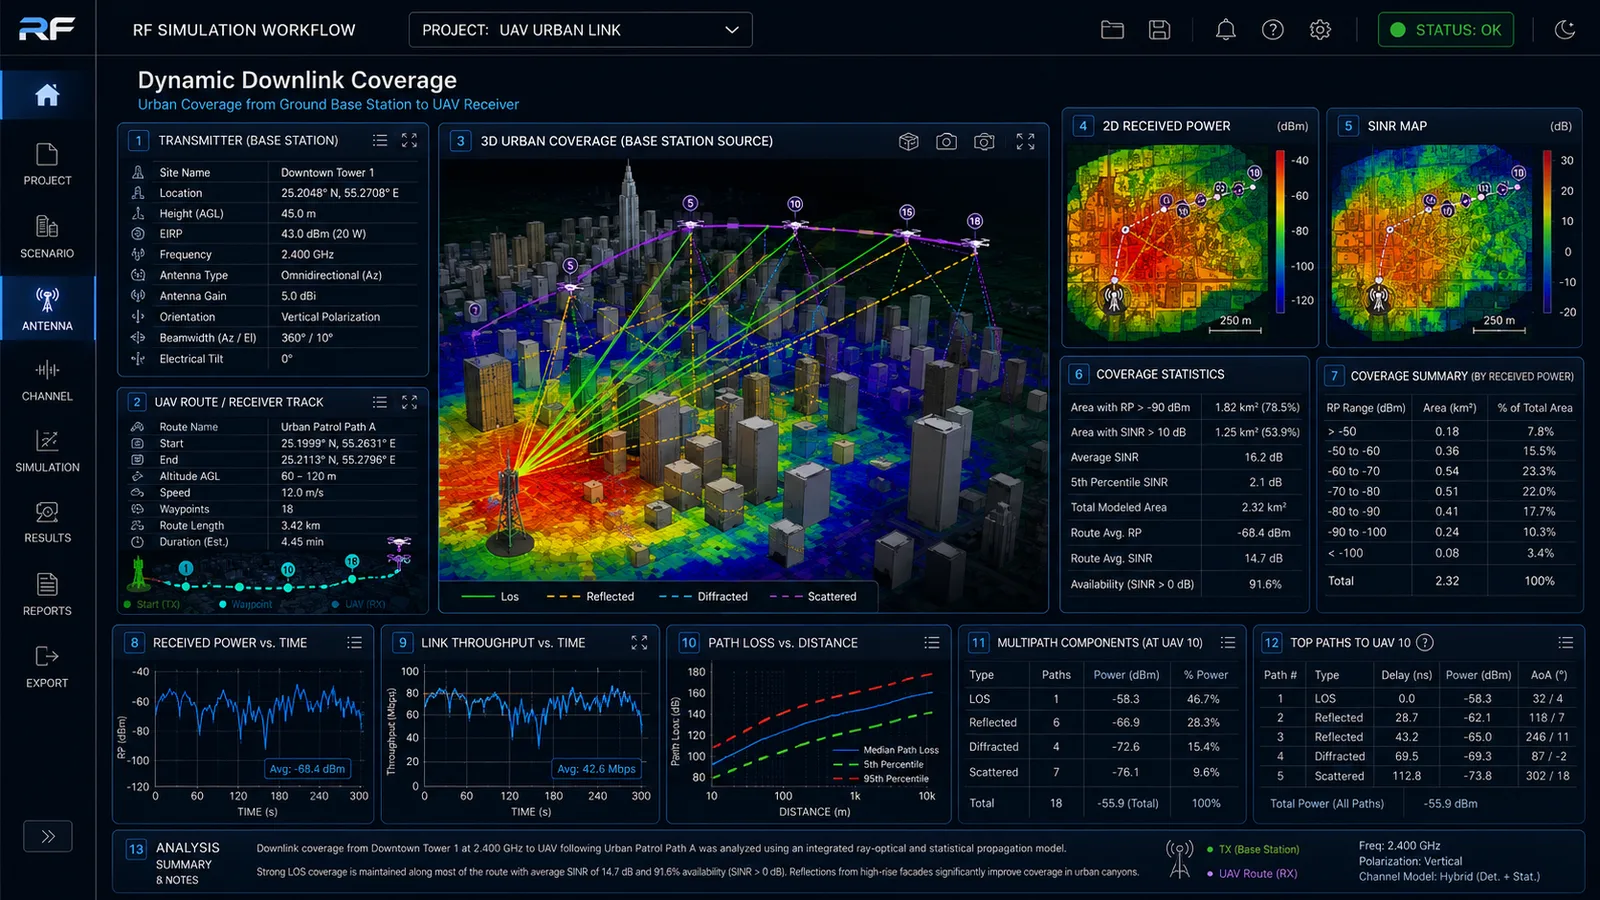
The cumulative effect is measurable. Less battery spent recovering from signal loss. Fewer reflights. Pre-flight deliverables that shift client conversations from uncertainty to documented expectation. The workflow moves in stages: antenna characterization, drone integration, dynamic propagation, network scaling, operational optimization, and telemetry feedback. Each stage answers a different question.

The return is operational. With route, link margin, and coverage validated before the aircraft moves, operators fly more complex missions with confidence and complete them in less time. The compound effect is more missions per crew-day, on work that would otherwise be out of reach.

A UAV communication system is a layered system

An antenna that performs well in isolation may behave differently once mounted on the drone. The airframe, battery, motors, carbon fiber arms, payload, camera gimbal, wiring, and onboard electronics can change the radiation pattern, reduce efficiency, shift resonance, or create orientation-dependent nulls.

Once the UAV is flying, the problem expands. The drone moves through changing geometry. Buildings, terrain, rooftops, towers, vegetation, and other objects affect propagation. The link may transition between line-of-sight and non-line-of-sight conditions. Multipath, diffraction, reflection, blockage, and shadowing cause received power and throughput to vary with position, altitude, orientation, and route.

In operational environments, this becomes more than an RF problem. Poor link performance can force operators to reposition, slow the flight, change the route, reduce video quality, pause the mission, or return to home. For multi-UAV deployments, shared spectrum, interference, and bandwidth contention further affect reliability. A model that stops at antenna performance misses airframe effects. A model that stops at propagation misses network contention. Without the full sequence, problems appear late, surfacing in testing or during a live mission.

Four stages, each adding operational reality to the last

The simulation follows the UAV from antenna in isolation through dynamic propagation along the mission route. Each stage below produces a specific artifact and answers a specific operational question. Figures shown are representative. Actual outputs are produced against the specific antenna, drone platform, mission route, and operating environment being modeled.

01 /Antenna Characterization
Idealized antenna behavior in isolation, the reference every later stage is compared against.

The antenna characterization stage establishes the baseline RF behavior before the antenna is integrated onto the drone. The goal is to understand the idealized behavior in isolation: the 3D radiation pattern, S-parameters, resonant frequency, impedance match, bandwidth, polarization, peak gain, realized gain, and radiation efficiency.

This stage answers whether the antenna supports the intended frequency band, what baseline gain and pattern exist before integration losses, whether there are directional nulls or polarization issues, and whether the antenna is suited for control, telemetry, video, or payload data links. It is the ceiling. It is the best the system can do before the drone itself enters the picture.

Antenna characterization, isolated antenna baseline
FIG 01Antenna Characterization · Isolated Antenna · UAV Baseline Case

NoteActual outputs reflect the specific antenna geometry, mounting configuration, and target frequency band of the platform being designed.

02 /Drone Integration
The UAV platform reshapes antenna performance once integrated.

A drone is not an RF-neutral structure. Depending on materials and layout, the airframe can scatter, block, absorb, or redirect energy. Carbon fiber is especially significant because it can behave as a lossy or conductive structure at RF frequencies. Motors, arms, batteries, payloads, cables, GPS modules, cameras, and gimbals can all influence electromagnetic behavior.

This stage evaluates antenna placement on the drone, airframe loading, payload shadowing, motor and arm scattering, battery and electronics interaction, orientation-dependent radiation behavior, and changes in S11, bandwidth, and efficiency. It answers whether the antenna still performs once mounted, whether the airframe creates nulls in operationally important directions, whether the payload blocks or detunes the antenna, and whether pitch, roll, yaw, or camera orientation affects link quality.

Drone integration, UAV platform loading
FIG 02Drone Integration · UAV Platform Loading · Integrated vs. Isolated Pattern Comparison

NoteActual outputs include airframe-integrated radiation patterns, near-field current distribution, and efficiency deltas for the specific drone platform and payload configuration being modeled.

03 /Dynamic Uplink Propagation
UAV as transmitter, ground station or relay as receiver.

Many UAV systems depend on transmitting telemetry, video, sensor data, or mission imagery from the aircraft back to the operator or network. The uplink is sensitive to UAV position, altitude, orientation, surrounding geometry, and link blockage.

This stage evaluates UAV-to-ground received power, uplink throughput over time, packet loss risk, latency variation, line-of-sight and non-line-of-sight transitions, multipath components, path loss versus distance, and route-dependent link degradation. It answers whether the UAV can maintain telemetry and data transmission along the mission route, where the uplink degrades, which parts of the route are at highest risk for dropout or poor video quality, and whether a relay, alternate operator position, or route change would improve reliability.

Dynamic uplink propagation, UAV transmitter, ground station receiver
FIG 03Dynamic Uplink Propagation · UAV Transmitter Source · Ground Station Receivers

NoteActual outputs show route-specific received power, throughput over time, path loss vs. distance, and dropout risk zones calibrated to the flight path and environment being modeled.

04 /Dynamic Downlink Coverage
Base station as source, UAV as moving receiver.

This stage evaluates the base station, access point, relay, or ground transmitter as the source and the UAV as the moving receiver. It is useful when the UAV relies on command links, control links, correction data, mission updates, or network-based connectivity from fixed infrastructure. It also helps evaluate how well the operating area is covered before the drone is deployed.

The stage evaluates base-station-to-UAV coverage, received power across the operational volume, SINR maps, route availability, coverage holes, altitude-dependent coverage, and expected command and control reliability. Downlink coverage and uplink propagation are related but not the same operational question. The uplink asks whether the UAV can transmit back. The downlink asks whether the operating infrastructure can reach the UAV reliably. Both must be answered before a mission is planned.

Dynamic downlink coverage, base station to UAV
FIG 04Dynamic Downlink Coverage · Base Station Source · UAV Route Receiver

NoteActual outputs show coverage heatmaps, SINR maps, route availability, and downlink margin statistics calibrated to the ground station placement, frequency, and mission area being modeled.

Where simulation pays back in the field

The simulation stages feed a small set of consequential decisions. The outcomes below are what an operator carries from planning into the field, into bids, and into long-term fleet operation.

01 /Shorter Flights
Less time hunting signal, more time flying.

Pre-flight simulation surfaces the parts of the route where link margin is thin before the aircraft takes off. Crews arrive at sites with antenna positions, ground-station locations, and altitude bands already validated against terrain, urban geometry, and carrier coverage. Less battery is spent maneuvering to re-establish a link, fewer data retransmissions cut into mission time, and the segments of flight that are pure overhead get measurably shorter.

02 /Higher Throughput and Larger Job Scope
More billable hours per crew, more bookable work.

The compounding effect of shorter flights and fewer reflights is more flights per crew-day. For drone operators, the bottleneck is crew-hours rather than aircraft cost, so each reduction in unproductive air time translates directly to revenue capacity. Documented coverage analysis also supports bids on work that is out of reach without it: BVLOS operations, multi-UAV deployments, and large industrial sites where link reliability across the whole site must be demonstrated before the contract is awarded.

03 /Customer Communication
The flight plan, before the flight.

Coverage maps, link-margin scenarios, and route reliability predictions become pre-flight deliverables shared with the client. The client sees where the system is confident and where it is marginal before any aircraft moves, which shifts the conversation from "we'll see what we get" to "here is what we expect." When marginal segments do produce reduced telemetry quality in flight, the result is consistent with the prediction rather than a surprise, and the post-flight report becomes a comparison against a pre-stated baseline.

04 /Regulatory and Insurance Position
Documented behavior supports waivers and premiums.

BVLOS waiver applications, airspace coordination requests, and operating-area approvals all want documented evidence that the operator understands link behavior across the operating envelope. Simulation outputs are that evidence. Insurance underwriters respond to documented, repeatable system behavior rather than to operator assertions, which supports premium negotiations and increases the set of carriers willing to underwrite the operation. Over time, fleet-wide telemetry validates the model and produces the historical record that supports the next round of waivers.

Where simulation does not solve the problem alone

Simulation does not replace flight ops decisions, weather and regulatory clearances, or live spectrum surveys. The boundaries below are explicit so the deliverable is read accurately.

01 /Throughput Depends on Demand
Saved flight time becomes more missions only when demand is the constraint.

Shorter flight times do not automatically translate into more billable missions. UAV work is not always high-volume. If the calendar is constrained by client demand, weather windows, or regulatory clearances, time saved per flight may accrue as buffer rather than as additional jobs. The throughput improvement shows up most clearly where the bottleneck is genuinely crew-hours or aircraft availability.

02 /Not Every Flight Depends on the Link
Autonomous routes over simple areas need less RF analysis.

Waypoint-navigated flights over low-complexity areas can be flown reliably with intermittent signal because the aircraft does not need a live link to follow its plan. Drones also carry obstacle avoidance, fail-safe behaviors, and return-to-home triggers that mitigate brief link loss. Simulation pays back most clearly on missions where the operator depends on live video, telemetry-driven decisions, or BVLOS coordination, not on every flight equally.

03 /Unknown Interference Is Out of Scope
The model accounts for known emitters, not unidentified ones.

Interference simulation is bounded by what is known. The model can include planned RF systems, documented incumbent emitters, and previously observed interference at the site. It cannot foresee unknown interferers ahead of deployment. Field reconnaissance, spectrum sweeps, or first-flight telemetry are the way to identify them, after which they can be incorporated into subsequent planning.

Integrating Simulation into UAV Deployments

Simulation is integrated at the planning layer, before route cards are issued and before any aircraft is on a deployment manifest. Each engagement begins with a scoping call to define the operating envelope: aircraft platform, antenna and payload configuration, target sites, ground-station infrastructure, mission profile, regulatory context, and the operational outcomes the deliverable needs to support.

Site geometry, terrain, and the RF environment are then captured as a working model, and the simulation stages run against the actual mission cases the operator expects to fly. Deliverables include the antenna and platform RF characterization, route-by-route link-margin predictions, coverage and SINR maps for the operating volume, multi-UAV and network performance analysis where it applies, an operational optimization summary, and a written brief that documents the analysis for the client, the insurer, and the regulator.

As the operator's fleet flies more jobs against pre-built models, the planning record grows. Post-flight telemetry from completed missions informs the next round of planning, and the simulation library becomes an internal asset that operators carry from one job to the next.

Planning a UAV Operation?

For UAV operators flying inspections, deliveries, mapping, surveillance, or BVLOS missions, we bring layered simulation across antenna, airframe, route, and network, so flight plans are validated and bids are evidence-backed before the aircraft is on a deployment manifest.